AI Stock Signals: What They Are and How to Judge Them
 Julia Villaran
Stock signals are specific buy or sell alerts for a stock, usually with an entry price and an exit rule, and AI trading signals are the ones produced by a machine-learning model rather than a person or a single chart indicator. You judge them the same way you would judge any forecaster: by a complete, timestamped record of real trades, including the losers, measured against a simple index fund over the same dates. This guide explains how AI stock signals are made, what the research says about whether they work, and the exact numbers to check before you trust one.
Key takeaways
A stock signal is only as good as its evidence. Rank that evidence from weakest to strongest: backtest, paper trades, live trades, then live trades checked by an independent verifier.
Win rate alone tells you almost nothing. Expectancy (average gain per trade after losses and costs) decides whether following a signal makes or loses money, and a 90% win rate can still lose.
Edges fade once they are known: in a study of 97 published stock-return predictors, returns were 58% lower after publication. Ask any provider how its record holds up out of sample.
Regulators say guaranteed returns, "100% win rates" and requests for your brokerage password are red flags. Investment scams cost Americans a reported $7.9 billion in 2025.
What are stock signals?
A stock signal is a rule-based prompt to act on a specific stock: buy it, sell it, or short it (bet on a fall). A complete signal answers four questions. Which stock? Which direction? At what price or time do you enter? And what tells you to exit, either a price target, a stop-loss (a preset price at which you sell to cap the loss) or a time limit?
Signals come from many places. A moving-average crossover on a chart is a signal. So is an analyst upgrade, a large institutional trade, or a model that flags a stock trading well below its estimated fair value. What they share is that they turn information into a decision you can test, which is also what makes them possible to judge.
AI trading signals are stock signals generated by a machine-learning model: software trained on historical data to find combinations of inputs (prices, fundamentals, earnings, options or institutional flows) that have preceded price moves. "AI" describes how the signal is made, not whether it works.
A signal is not the same as advice tailored to you. It does not know your tax situation, your other holdings or how much you can afford to lose. That is why sizing each position is your job, even when the signal is good.
How AI trading signals are made
Almost every AI signal system follows the same four-step chain. Each step is a place where an impressive-looking result can quietly break.
Data. The model reads inputs such as daily prices, financial statements, earnings dates, analyst estimates, options activity and off-exchange (dark pool) trades. The data must be "point in time": only what was actually known on the day, not later revisions.
Model. A machine-learning model looks for patterns that preceded gains or losses. Common types include gradient-boosted trees, neural networks and, more recently, language models that read filings and news.
Signal. When today's inputs match a pattern strongly enough, the system issues an alert with a direction, an entry window and an exit rule.
Execution. Someone has to trade it. Real fills include spreads (the gap between buy and sell prices), commissions and slippage (getting a worse price than the alert showed). A model that ignores this step only describes what might have happened.
A 2026 review of AI research in equity markets (Zhu and Cai) summed up the gap neatly: progress has been real at the prediction stage, but evidence is much thinner for durable returns after costs, and audited live-capital records are rare. That gap is exactly what you are checking when you judge a signal.
Types of stock signals compared
The word "signal" covers very different products. Knowing which type you are looking at tells you what can go wrong with it.
| Signal type | What it uses | Best for | Weak spot |
|---|---|---|---|
| Technical indicator | Price and volume patterns (moving averages, RSI, breakouts) | Short-term timing | Free to copy, so any edge is quickly traded away |
| Analyst rating | Human research, price targets, upgrades and downgrades | Company context | Slow to change, and conflicts of interest are possible |
| Social or copy signal | Posts, chat rooms, "follow this trader" | Spotting ideas early | Rarely a complete record; winners get reposted, losers vanish |
| AI model signal (backtested) | Machine-learning model tested on past data | Screening many stocks at once | Overfitting: the model can memorize the past |
| AI model signal (live-traded) | The same model, with every alert traded in a funded account | Investors who want proof before acting | Shorter history than a backtest; past results still don't guarantee future ones |
The live-traded row is the one to prefer, not because the model is smarter but because the evidence is harder to fake. For a wider view of apps that sell these signals, see our comparison of the best AI trading software.
Do AI stock signals actually work?
Some do, for a while, under some conditions. Two bodies of evidence explain why skepticism is the right default.
Edges shrink once they are known
In one of the most cited papers on the topic, finance professors David McLean and Jeffrey Pontiff tested 97 variables that academic studies had shown could predict stock returns. Compared with the original study period, the average strategy earned 26% less out of sample (after the study period but before publication) and 58% less after the research was published, as investors learned about it and traded it away.
What happens to published stock signals after discovery
The lesson for AI trading signals is direct. A model that found a real pattern in 2015–2020 data may be trading a pattern that thousands of other models now also see. That is why recent live results matter more than a long backtest.
Even professionals rarely beat the index
The second benchmark is humbling. S&P Dow Jones Indices has tracked active fund managers against their benchmarks since 2002 in its SPIVA scorecards. Over 20 years to the end of 2024, 91.99% of active US large-cap funds trailed the S&P 500. In calendar 2025 alone, 79% did.
Active US large-cap funds that trailed the S&P 500, by time horizon
These are full-time teams with research budgets. Any signal service claiming to beat the market should therefore be measured against the same yardstick: what would an S&P 500 index fund have returned over the exact same dates? If a provider will not show that comparison, treat the omission as information.
Look for a benchmark line on the provider's performance chart and check that it starts on the same day as the strategy. A strategy that "beat the market" from a cherry-picked start date often looks ordinary from any other.
How to judge stock signals: the numbers that matter
Marketing pages lead with win rate because it is the easiest number to make look good. These are the numbers that actually decide whether following a signal service would have made you money.
Win rate
The share of closed trades that made money. It is useful only alongside the size of wins and losses. Many small wins and a few large losses can produce a high win rate and a losing account.
Expectancy
The average result per trade once wins and losses are weighted by how often they happen: (win rate × average win) − (loss rate × average loss), minus trading costs. If expectancy is negative, more trades only means losing faster.
Profit factor
Total gains divided by total losses. Above 1 means the winners paid for the losers; below 1 means they didn't.
Maximum drawdown
The largest fall from a peak to a low before a new peak. It tells you how much pain you would have had to sit through, which is when most people abandon a strategy.
Sharpe ratio and beta
The Sharpe ratio measures return per unit of volatility; higher means a smoother ride for the same gain. Beta measures how much a strategy moves with the overall market: a beta of 1 moves in step with it, a beta near 0 moves largely independently.
Worked example: why a 90% win rate can lose money
Illustrative example. Two signal services each send 50 trades. Service A advertises a 90% win rate. Service B wins only 45% of the time. Assume a round-trip trading cost of 0.2% per trade for both.
- Service A's gross expectancy. 90% of trades gain 2% on average; 10% lose 20% on average. (0.90 × 2%) − (0.10 × 20%) = 1.8% − 2.0% = −0.2% per trade.
- Service B's gross expectancy. 45% of trades gain 6% on average; 55% lose 2.5% on average. (0.45 × 6%) − (0.55 × 2.5%) = 2.7% − 1.375% = +1.325% per trade.
- Subtract costs. A: −0.2% − 0.2% = −0.4% per trade. B: 1.325% − 0.2% = +1.125% per trade.
- Check the profit factor. A: 1.8 ÷ 2.0 = 0.9 (losers outweigh winners). B: 2.7 ÷ 1.375 = 1.96 (winners nearly double the losers).
- Scale to 50 trades. Adding up per-trade results (ignoring compounding), A: 50 × −0.4% = −20 percentage points. B: 50 × 1.125% = +56.25 percentage points.
The service with half the win rate is the better one. You can only see that if the provider publishes every trade with its entry and exit price, which is why a full trade list beats any headline percentage.
Some services quietly move targets or remove trades that went wrong, which inflates the win rate. Copy a few alerts into your own spreadsheet as they arrive, then compare with what the provider shows a month later.
Backtested, paper or live: grading the evidence
The same 70% win rate means very different things depending on where it came from. A backtest runs a model over historical data to show what it would have done. Paper trading records hypothetical trades in real time without money. Live trading places real orders in a funded account. The US futures regulator, the CFTC, notes that hypothetical results can ignore spreads, failed stop orders and the trader's ability to sit through losses, and can be built from the historical trades that look best.
| Evidence | Good sign | Average | Warning |
|---|---|---|---|
| Source of results | Live trades in a funded account | Paper trades logged in real time | Backtest only, or "hypothetical" in small print |
| Trade list | Every trade with dates, prices, wins and losses | Monthly summaries | Screenshots of winning trades |
| Verification | Independent verifier, such as a GIPS® verification | Broker statements shown on request | No way to check |
| Benchmark | S&P 500 over identical dates | A benchmark from a different start date | No benchmark |
| Risk numbers | Drawdown, Sharpe and beta published | Win rate and total return only | "Can't lose" or guaranteed returns |
| Signal explanation | Each alert shows the data behind it | Strategy described in general terms | "Proprietary black box", nothing more |
GIPS (Global Investment Performance Standards) are voluntary rules maintained by CFA Institute for calculating and presenting investment performance fairly, with full disclosure. A firm that claims compliance cannot show only its best accounts or best periods, and a verification adds an outside check of its policies. You can read how this works in practice on our GIPS compliance page.
Red flags regulators warn about
The FTC's Consumer Sentinel data shows why caution pays. In 2024, consumers reported $5.7 billion in losses to investment-related fraud, with a median loss of $9,196, the highest median loss among the top 10 fraud categories. In 2025, reported investment-scam losses rose to $7.9 billion, about half of all reported fraud losses. In January 2024 the CFTC issued an advisory titled "AI Won't Turn Trading Bots into Money Machines", and the SEC, NASAA and FINRA issued a joint alert the same day.
Walk away from any signal provider that promises guaranteed or "tens of thousands of percent" returns, claims a 100% win rate, asks for your brokerage username and password, or pressures you to pay in crypto. Each of these appears in CFTC, SEC or FINRA investor warnings.
FINRA adds a newer warning: "AI washing", where an app overstates or invents its use of AI to look more advanced. A legitimate provider can explain in plain words what data its model uses and what triggers an alert. You can also look up registered firms and people on FINRA BrokerCheck and the SEC's adviser database before you pay anything.
Common mistakes investors make with signals
Trusting the win rate. As the worked example shows, it can hide a negative expectancy. Ask for average win, average loss and profit factor.
Judging from a short or hand-picked sample. A handful of trades in one kind of market says little. Look for hundreds of closed trades across rising and falling markets, and check whether recent results match older ones.
Ignoring costs and timing. If an alert arrives after the move, your entry is worse than the provider's. Compare your actual fills with the published entry prices for your first few trades.
Betting too much per signal. Even a strong signal loses often. Risk a small, fixed slice of your portfolio on each one so a string of losers can't do lasting damage.
Following signals you don't understand. If you can't say why a stock was flagged, you won't know when the reason has gone. Read the explanation behind each alert, and learn the basics, such as how to find undervalued stocks, so you can sanity-check valuation signals yourself.
How TruthSayer AI publishes its stock signals
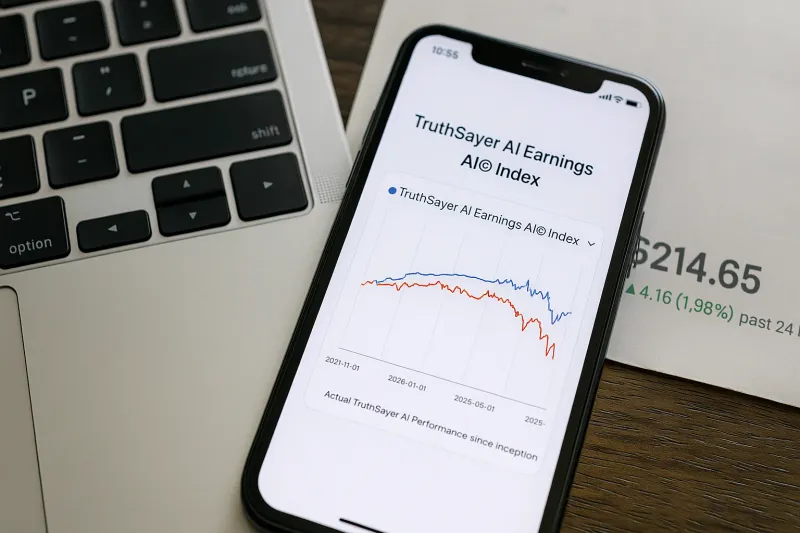
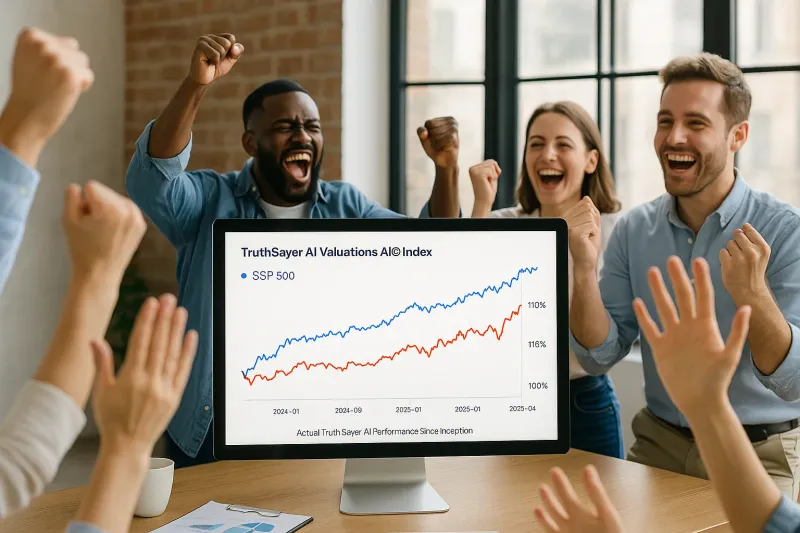
TruthSayer AI runs three models. Valuations AI© looks for US-listed stocks that may be mispriced against fair-value estimates. Earnings AI© forecasts post-earnings moves, with alerts sent 1–4 hours before a report. Dark Pools AI© detects unusually large institutional trades and confirms price direction. Every alert is traded in a live funded account before it reaches users, and the trade tables on each page list the losing trades next to the winners.
As published on October 30, 2026, the headline figures were:
| Model | ROI since inception | Historical win rate | Average hold | Sharpe | Beta |
|---|---|---|---|---|---|
| Valuations AI© | 78.65% | 73.5% | 68 days | 2.72 | 0.43 |
| Earnings AI© | 33.13% | 72.7% | 30 days | 3.94 | 0.30 |
| Dark Pools AI© | 33.83% | 65.9% | 45 days | 2.72 | 0.97 |
The point of showing this is not the size of the numbers. It is that you can test them with the same checklist used above: every trade is listed with entry, exit and date, the record is live-traded rather than backtested, and TruthSayer AI claims compliance with GIPS®, with firm-wide policies independently verified for September 1, 2024 to June 30, 2026. The composite reports are on the GIPS page. TruthSayer AI never holds your money or trades in your account; you decide whether to act on each alert. To see how it compares with other apps on these points, read our guide to the best AI stock apps, or start with the free AI stock pickers if you'd like to test signals before paying.
The bottom line: AI stock signals are a way of turning data into testable buy and sell decisions, and testable is the key word. Judge them on a complete record of live trades, expectancy after costs, drawdown and a same-dates comparison with the S&P 500, not on win rate or the word "AI". Most strategies fade and most professionals trail the index, so the burden of proof sits with the provider. Use signals you can verify, size each position small, and walk away from anything that promises certainty.
Frequently asked questions
Are AI trading signals accurate?
Some are accurate more often than not, but accuracy alone is the wrong test. A signal can be right 90% of the time and still lose money if its losses are much larger than its wins. Judge accuracy together with average win, average loss, costs and drawdown, using live trades rather than a backtest.
Do stock signals really work?
Some do for a period, but research shows edges shrink: published stock predictors earned 58% less after publication. Most active funds also trail the S&P 500 over long periods. A signal works for you only if its live, after-cost record beats a simple index fund over the same dates.
How can I tell if a signal service is a scam?
Warning signs include guaranteed returns, claims of a 100% win rate, only winning trades shown, pressure to pay in crypto, and requests for your brokerage login. Check the firm on FINRA BrokerCheck or the SEC adviser database, and ask for a complete trade history before paying anything.
What is a good win rate for trading signals?
There is no single good number, because win rate depends on the strategy. Trend-following systems can profit while winning under half their trades, if winners are much larger than losers. Look at expectancy and profit factor instead; a profit factor above 1 after costs means the winners paid for the losers.
Are free stock signals worth using?
They can be, if the provider shows the same evidence a paid service should: a full, dated trade list with losses, a benchmark and an explanation for each alert. Free is a reasonable way to test a provider with small positions before paying, but price says nothing about quality in either direction.
Is following stock signals legal?
Yes. Acting on signals in your own brokerage account is legal. What regulators police is the provider: firms giving personalized investment advice or trading for clients usually must be registered, and misleading performance claims are prohibited. Avoid any service that wants to trade your account through your password.
Sources
- McLean, R. D. & Pontiff, J. (2016). Does Academic Research Destroy Stock Return Predictability? Journal of Finance 71(1)
- S&P Dow Jones Indices: SPIVA U.S. Scorecard Year-End 2024
- S&P Dow Jones Indices: SPIVA U.S. Year-End 2025 (March 2026)
- FTC: Testimony before the Joint Economic Committee on fraud (March 25, 2026)
- FTC: Consumer Sentinel Network Data Book 2024
- CFTC: Customer Advisory, AI Won't Turn Trading Bots into Money Machines (January 2024)
- CFTC: Commodity Trading Systems Sold on the Internet (hypothetical results)
- SEC, NASAA and FINRA: Artificial Intelligence and Investment Fraud investor alert (January 2024)
- FINRA: Know the Risks of Auto-Trading Services Offered by Unregistered Entities (July 2025)
- Zhu, L. & Cai, M. (2026). Artificial Intelligence in Equity and Crypto Markets: Progress, Profitability Evidence, and the Limits of Automated Investing
- TruthSayer AI: Valuations AI© Index (figures as of Oct. 30, 2026)
- TruthSayer AI: Earnings AI© Index (figures as of Oct. 30, 2026)
- TruthSayer AI: Dark Pools AI© Index (figures as of Oct. 30, 2026)
- TruthSayer AI: GIPS® compliance and verification reports
This article is for educational purposes only and is not investment advice. Past performance does not guarantee future results.
Julia Villaran
With a strong foundation in business development and consultancy, Julia has a keen analytical approach to risk-managed portfolio growth. Her strategic insight and market expertise make her a trusted advisor for individuals and organizations navigating the complexities of today's investment landscape. She combines deep market understanding with a research-driven approach to help uncover high-potential investment opportunities and build resilient financial strategies.