Backtested vs Live-Traded Signals: Why the Difference Matters
 Nathan Njuguna
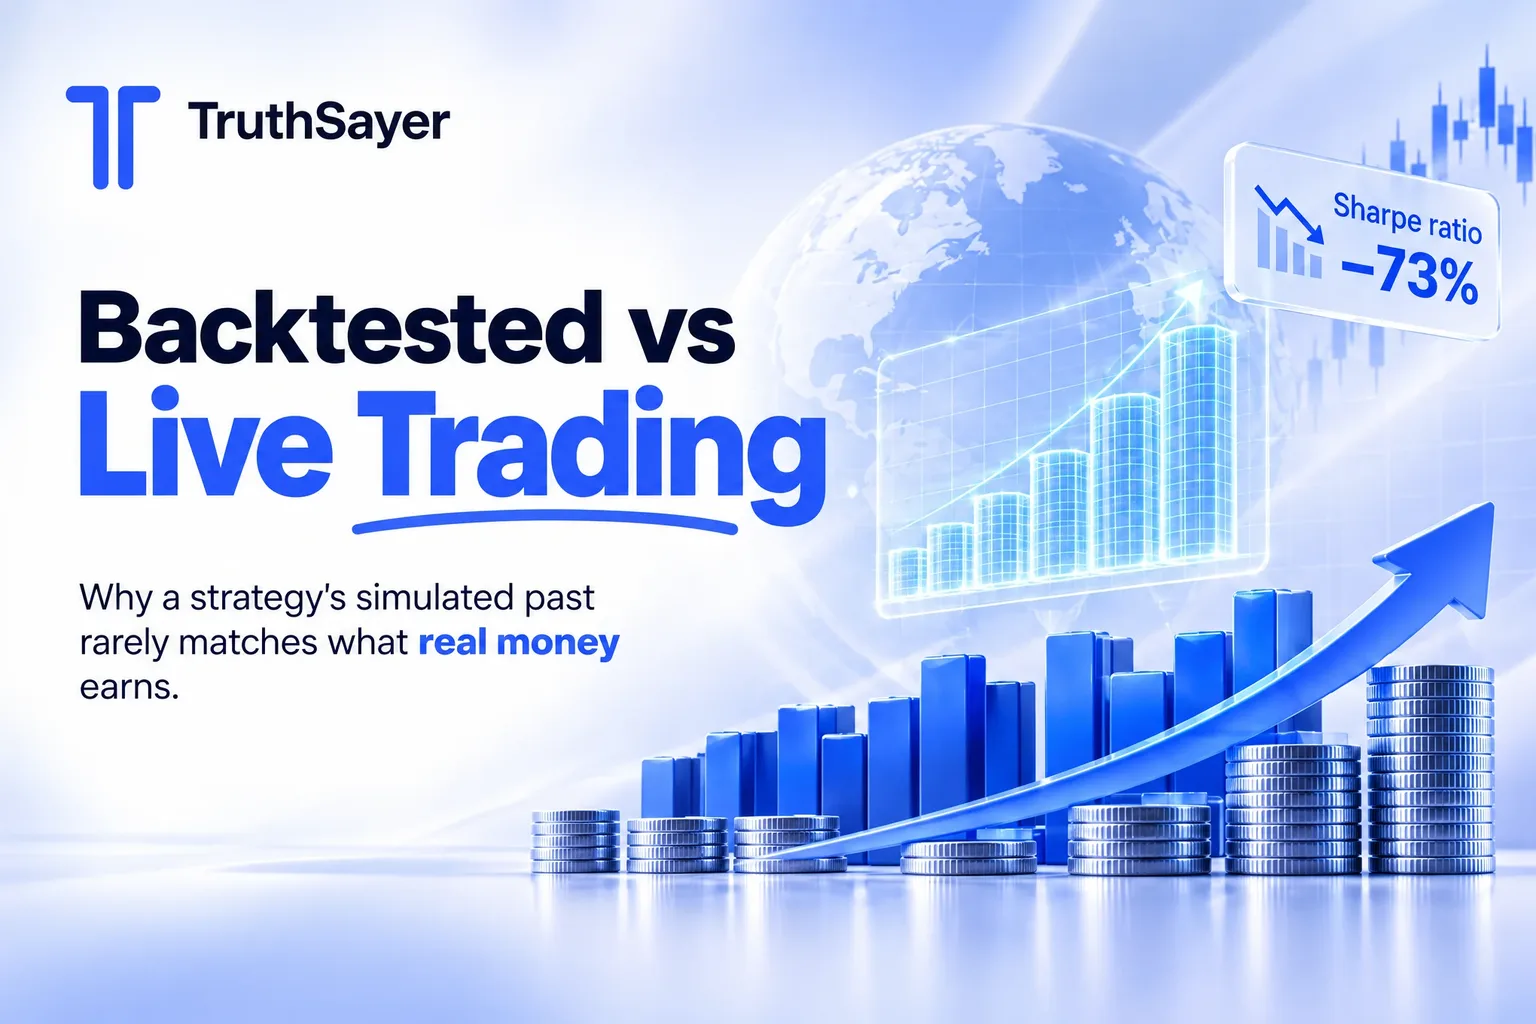
Backtested vs live trading is the difference between what a strategy would have earned on past data and what it actually earned with real orders in a funded account. Live results are usually much worse: across 215 strategies built by 15 investment banks, the median Sharpe ratio fell 73% once they went live.
A backtest is a simulation that applies trading rules to historical prices. A live-traded signal is one that someone actually bought or sold, at real prices, paying real costs.
This guide is for investors deciding whether to trust a signal service, a newsletter or their own strategy. You will learn why backtests flatter, how big the gap is, how long a live record must run before it means anything, and a six-step test you can apply to any track record.
Key takeaways
Live results usually fall short of backtests: in a study of 215 alternative beta strategies, the median Sharpe ratio dropped from 1.20 in backtests to 0.31 live, and 30% of the strategies had a negative Sharpe ratio live.
Backtested Sharpe ratios barely predict live ones: across 888 Quantopian algorithms, backtest Sharpe explained less than 2.5% of the variation in out-of-sample Sharpe (R² < 0.025).
Testing many variations manufactures fake winners: with 5 years of data, trying more than 45 independent strategy variations can produce a backtested Sharpe ratio of 1 from pure noise.
A short live record proves less than it seems: by Andrew Lo's formula, a strategy with a Sharpe ratio of 1.0 needs about 6 years of returns before its edge is statistically distinguishable from zero.
Regulators treat backtests as hypothetical performance: the SEC fined 9 advisers a combined $850,000 in 2023 for showing hypothetical performance on public websites without required policies.
What is the difference between backtested and live-traded signals?
A backtested signal is one that a model would have generated on historical data; a live-traded signal is one that was generated in real time and then executed with real money. The first is a reconstruction. The second is a record.
Between those two sits a ladder of evidence. Each rung removes one way for a result to be flattered:
- In-sample backtest. Rules are built and tested on the same historical data. This is the weakest evidence.
- Out-of-sample or walk-forward backtest. Rules are built on one period and tested on a later period the designer did not use.
- Paper trading (forward testing). Signals are logged in real time, but no orders are placed, so there are no real fills or costs.
- Live trading, self-reported. Real orders in a funded account, reported by the provider.
- Live trading, complete and independently checked. Every trade published, losses included, with an outside verification of how performance is reported.
Out-of-sample means data the strategy designer did not look at while building the rules. A result is only out-of-sample if the designer could not have changed the rules after seeing it.
Why do backtests look better than live trading?
Backtests look better than live trading because the person building them knows how history turned out, and because simulations leave out frictions that real orders pay. Seven gaps explain most of the difference:
Overfitting. The more rule variations a researcher tries, the more likely one fits past noise. Bailey, Borwein, López de Prado and Zhu showed that with 5 years of data, no more than 45 independent variations should be tried; with 2 years, no more than 7.
Look-ahead bias. The test uses information that was not available on the trade date, such as earnings figures that were restated months later.
Survivorship bias. The test runs only on companies listed today, silently skipping those that went bankrupt or were delisted.
Costs and slippage. Spreads, commissions and slippage (getting a worse price than the signal price) are often understated or ignored.
Liquidity. A backtest can "buy" any size at the closing price; a real order in a thin stock moves the price against you.
Stops that do not fill. A stop-loss at $50 in a backtest exits at $50; in a live market, a gap down can fill it at $44.
Behavior. A simulated trader never panics, skips a signal or doubles down after a loss.
US futures regulators require these limits to be spelled out. Under CFTC Rule 4.41, anyone presenting simulated results for commodity interests must include this statement:
"These results are based on simulated or hypothetical performance results that have certain inherent limitations. Unlike the results shown in an actual performance record, these results do not represent actual trading."
— US Commodity Futures Trading Commission, 17 CFR § 4.41(b)(1)
The SEC goes further for investment advisers. Its Marketing Rule, in force since November 4, 2022, says advisers generally cannot show hypothetical performance, which includes backtests, to a mass audience. In September 2023 the SEC charged 9 advisers for doing so on their websites, with penalties of $50,000 to $175,000 each.
How much worse are live results than backtests?
Live results are usually far worse than backtests on a risk-adjusted basis: in the largest bank-strategy study, the median live Sharpe ratio was 73% lower. The best evidence comes from two large studies that compared the same strategies before and after they went live.
215 bank strategies: a 73% Sharpe ratio haircut
Antti Suhonen, Matthias Lennkh and Fabrice Perez studied 215 "alternative beta" strategies sold by 15 investment banks, each with a backtest (average 10.7 years) and a live track record (average 4.6 years). The median Sharpe ratio, a measure of return per unit of risk, fell from 1.20 to 0.31.
Backtested vs live trading: median Sharpe ratio of 215 strategies
| Live outcome, 215 strategies | Strategies | Share |
|---|---|---|
| Live Sharpe equal to or above backtest | 18 | 8.4% |
| Live Sharpe positive but below backtest | 132 | 61.4% |
| Live Sharpe negative | 65 | 30.2% |
The most complex strategies, those with the most rules, filters and parameters, lost over 30 percentage points more of their Sharpe ratio than the simplest ones. The authors also found that the common industry habit of cutting backtested Sharpe ratios by 50% is "not conservative enough".
888 algorithms: backtest Sharpe barely predicts live Sharpe
Thomas Wiecki and colleagues at Quantopian compared backtests with out-of-sample results from June 2015 to February 2016 for 888 trading algorithms. Backtested Sharpe ratios had almost no predictive value (R² below 0.025). Risk measures carried over far better: volatility (R² 0.67) and maximum drawdown (R² 0.34).
How well does a backtest predict live results? (R² by metric)
The lesson is useful: a backtest tells you more about how bumpy a strategy will be than about how much it will earn. The same study found that the more backtests a developer ran, the bigger the gap between backtest and live performance. Published academic signals show the same decay; we covered that evidence in our guide to AI stock signals.
What does a real live trade look like next to its backtest version?
A live trade has a dated entry, a dated exit and a booked result that includes how the order actually filled. Here is one closed trade from TruthSayer AI's public Valuations AI© table, worked through step by step.
- The entry. Microsoft (MSFT) was entered at $375.38 on April 8, 2026.
- The exit. The position closed at $517.51 on September 25, 2026, after 170 days.
- The backtest version. A simple backtest books the price change: $517.51 ÷ $375.38 − 1 = 37.86%.
- The live version. The funded-account trade table records +37.82%, 0.04 percentage points below the raw price change.
- The portfolio effect. At TruthSayer's 5% position size, the trade added 5% × 37.82% = 1.89 percentage points to the account.
The gap here is tiny because Microsoft is one of the most liquid stocks in the world and the holding period was long. The gap grows with trading frequency and with smaller, less liquid stocks.
Illustrative example: assume each round trip costs 0.20% in spread and slippage combined (an assumption, not a measured figure). A position slot that turns over 30 times a year gives up about 30 × 0.20% = 6 percentage points a year. One that turns over 3 times a year gives up 0.6 points. High-frequency strategies need far more realistic cost modelling than slow ones.
Does a live track record prove a strategy works?
Not on its own, and this is where most advice stops too early. "Live beats backtest" is true, but a short live record is still a small sample. Luck can produce a great year, and statistics tell you how long a record must run before luck becomes an unlikely explanation.
Andrew Lo, a professor at MIT Sloan, derived the standard error of an annualized Sharpe ratio in 2002. Under independent returns, it is roughly √((1 + SR²/2) ÷ years). We used that formula to compute how many years of returns each Sharpe ratio needs to reach a t-statistic of 2, a common bar for "probably not luck".
- Pick a Sharpe ratio. Take SR = 1.0 over 1 year.
- Compute the standard error. √((1 + 1²/2) ÷ 1) = √1.5 = 1.22.
- Compute the t-statistic. 1.0 ÷ 1.22 = 0.82, well below 2.
- Solve for the years needed. Years = 4 × (1 + SR²/2) ÷ SR² = 4 × 1.5 ÷ 1 = 6.0 years.
Years of live returns needed before a Sharpe ratio is statistically meaningful
The same math applies to us. Valuations AI© publishes a Sharpe ratio of 2.71, which needs about 2.5 years by this test. Its public index starts on September 27, 2024, so on October 30, 2026 the record was 2.1 years old, giving a t-statistic of about 1.8. That is close to the bar, not past it, and it is why we keep publishing every trade rather than asking anyone to trust one number.
The Sharpe ratio is a strategy's average return above the risk-free rate divided by the volatility of its returns. A higher Sharpe ratio means more return per unit of risk. Lo also showed that serial correlation can overstate an annual Sharpe ratio by as much as 65%, so treat any single figure with care.
Live records can also be cherry-picked. A provider can run 10 accounts and show the best, or launch many strategies and keep only the survivors. That is why completeness, every trade and every account, matters as much as "live". Our guide to what GIPS compliance means explains the industry rules that stop firms from dropping losing portfolios.
How do backtests, paper trading and live records compare?
Backtests, paper trading and live records each answer a different question, and none of them is the best tool for every job. This table compares them on what matters to an investor deciding whether to follow a signal.
| Evidence | What it shows | Best for | Weak spot |
|---|---|---|---|
| In-sample backtest | How rules fit the data they were built on | Early research | Overfitting; hindsight |
| Walk-forward backtest | How rules did on unseen past data | Filtering ideas before risking money | Still hypothetical; costs assumed |
| Paper trading | Signals logged in real time | Checking a model runs as designed | No real fills, costs or emotions |
| Live, self-reported | Real orders and costs | Seeing true execution quality | Accounts or trades can be selected |
| Live, every trade published, independently verified | Complete real record with outside checks on reporting | Deciding whether to follow a signal service | Shorter history; past results do not guarantee future ones |
Backtests are fast but easy to overfit. Paper trading removes hindsight but ignores costs and behavior. Complete live records are the hardest to fake but take years to become meaningful.
What counts as good, average and weak evidence?
| Check | Good sign | Average | Warning |
|---|---|---|---|
| Labelling | Every figure marked backtest, paper or live | Live and backtest shown separately | One chart that blends both |
| Trade list | Every trade with dates, prices and losses | Monthly returns only | Screenshots of winners |
| Live length | Long enough for its Sharpe ratio (see chart above) | 1–2 years | Under 6 months |
| Costs | Results from real fills | Stated cost assumptions | No mention of costs |
| Variations tested | Number of trials disclosed | Method described | "Optimized" with no detail |
| Benchmark and risk | S&P 500 on identical dates, drawdown, beta | Benchmark from another start date | No benchmark |
Which kind of evidence should you rely on?
The right evidence depends on whether you are building a strategy or buying one, and on how often it trades.
Best for building your own strategy
Use an in-sample backtest to explore, a walk-forward test to filter, then small live positions to measure real costs. Write down how many variations you tried; Bailey and colleagues' 45-variation limit for 5 years of data is a useful ceiling.
Best for choosing a signal service
Ignore the backtest and ask for the complete live trade list, losses included, with a benchmark on the same dates. A provider that only shows simulated results has not yet paid the costs you will pay.
Best for long-term value investors
Slow strategies, with holds of weeks or months, lose little to trading costs, so their backtests and live results can sit closer together. They also produce fewer trades per year, so the record needs more years before it means much.
Best for short-term and earnings traders
For strategies that hold for days, execution decides the result. Check that live results come from real fills and compare the average live trade with the backtest's average trade.
Who this approach is not right for
Investors who want certainty will not find it in any record, live or simulated. Beginners should also avoid optimizing their own backtests until they understand overfitting; a broad index fund needs no backtest at all.
What does it cost to test a strategy live, and how long does it take?
Testing a strategy live costs real trading costs and real time; the money at risk can stay small, but the calendar cannot be shortened. Plan for all four costs:
Data. Free price data is fine for a first look, but a serious backtest needs data that includes delisted companies to avoid survivorship bias, which usually costs money.
Trading costs. Spreads and slippage are paid on every live trade; they are the main reason live returns trail backtests for fast strategies.
Taxes. In the US, gains on assets held one year or less are short-term and taxed at ordinary income rates, according to the IRS. A backtest rarely shows after-tax results.
Time. Using the chart above, a strategy with a Sharpe ratio of 1.0 needs about 6 years of returns, and one with 2.0 needs about 3, before its live record is statistically meaningful.
Decide your "stop testing" rule before you go live. For example: stop if live results trail the backtest by more than half after 50 trades, or if drawdown exceeds the worst backtested drawdown. Writing it down first stops you from moving the goalposts later.
After you go live, log every trade and resist re-optimizing after a losing month.
What are the most common mistakes when comparing backtested and live results?
The most common mistake is treating a backtest as a forecast. These five errors cost investors the most:
Comparing Sharpe ratios one-to-one. A backtested Sharpe of 2.0 is not comparable with a live Sharpe of 2.0. The 215-strategy study found a median 73% haircut.
Ignoring the number of trials. A backtest that does not say how many variations were tried cannot be judged for overfitting.
Judging on a few months of live data. Under Lo's formula, one year of a Sharpe 1.0 strategy gives a t-statistic of just 0.82.
Blending backtest and live returns in one chart. The GIPS standards do not allow theoretical performance to be linked with actual performance, for exactly this reason.
Trusting live records with gaps. Missing trades, missing months or a "since we relaunched" start date are signs of selection.
How do you test a track record? The TruthSayer Live-Proof Test
The TruthSayer Live-Proof Test is a six-step check for any signal, newsletter or strategy record, built from the research in this guide.
- Check the label. Is every number marked as backtested, paper or live? If you cannot tell, assume backtested.
- Check completeness. Is every trade listed with entry date, entry price, exit date, exit price and result, losses included?
- Check the length. Compare the live record's age with the years its Sharpe ratio needs (Sharpe 1.0: about 6 years; 2.0: about 3).
- Check the costs. Are results from real fills? How often does it trade, and how liquid are the stocks?
- Check the benchmark and risk. Compare with the S&P 500 over identical dates, and look at maximum drawdown and beta.
- Check independence. Has an outside party tested how performance is reported, for example a GIPS verification?
How does TruthSayer AI use live trading instead of backtests?
TruthSayer AI trades every alert from its three models in a live funded account before the alert reaches users, and publishes the resulting trades, winners and losers, on each model page. The trading rules are fixed: a 5% position size per trade, a trailing stop at 3 times the average true range (ATR, a measure of a stock's typical daily price range), and averaging down only when a stock is 2 to 3 standard deviations below fair value.
| Model | Index start | Trades listed | Closed (profitable / losing) | ROI since inception | S&P 500, same dates | Sharpe |
|---|---|---|---|---|---|---|
| Valuations AI© | Sept 27, 2024 | 209 | 150 / 43 | 78.93% | 32.47% | 2.71 |
| Earnings AI© | Oct 3, 2024 | 1,439 | 1,012 / 347 | 31.60% | 35.09% | 3.89 |
| Dark Pools AI© | Oct 31, 2024 | 337 | 217 / 106 | 33.72% | 29.95% | 2.71 |
Figures as published on November 3, 2026. TruthSayer AI claims compliance with the GIPS standards, with firm-wide policies and procedures independently verified for September 1, 2024 through June 30, 2026; the composite reports are on the GIPS page. TruthSayer AI never holds client money or trades in your account.
Run through the Live-Proof Test, the records pass the label, completeness, cost and benchmark checks, and Earnings AI© shows a lower raw return than the S&P 500 over its dates. On length, all three records are about two years old, which is close to but not yet past the bar for their Sharpe ratios.
How we chose
We built the Live-Proof Test from peer-reviewed and regulatory sources: the 215-strategy study by Suhonen, Lennkh and Perez, the 888-algorithm Quantopian study, Bailey and colleagues' minimum backtest length, Lo's Sharpe ratio statistics, CFTC Rule 4.41 and the SEC Marketing Rule. The length test in step 3 is our own calculation from Lo's formula, shown in full above.
What should you do next?
Take one strategy or service you are considering and run the six-step Live-Proof Test on it today. If it fails step 1 or 2, you can stop there. Then go deeper:
Learn how performance-reporting rules work: what GIPS compliance means for investors.
Check the other numbers behind a signal, such as expectancy: how to judge AI stock signals.
Compare apps on proof and price: AI trading software compared.
See how a real strategy is built and risk-managed: the hedge fund investment strategy retail investors can use.
Browse a live trade list yourself on Earnings AI©, or look up terms in our investing glossary.
The bottom line: A backtest shows what a strategy might have done; a live record shows what it did, and the evidence says the gap is large, with a median 73% drop in Sharpe ratio across 215 strategies. Live records are better evidence, but only when they are complete and long enough to rule out luck. Use the TruthSayer Live-Proof Test on any record before you follow it: label, completeness, length, costs, benchmark and independence. Builders should treat backtests as research; buyers should ask for the live trade list.
Frequently asked questions
Why do backtest results differ from live trading?
Backtests differ from live trading because they are built with hindsight and skip real-world frictions: overfitting, look-ahead and survivorship bias, spreads, slippage, unfilled stops and human behavior. In a study of 215 bank strategies, the median Sharpe ratio fell from 1.20 in backtests to 0.31 once the strategies went live.
How much should I discount a backtest?
Discount a backtested Sharpe ratio by at least half, and more for complex strategies. Suhonen, Lennkh and Perez found a median 73% drop across 215 strategies and called the common 50% haircut "not conservative enough". Only 18 of the 215, or 8.4%, matched their backtest once live.
How long should a strategy trade live before I trust it?
It depends on its Sharpe ratio. Using Andrew Lo's 2002 formula, a Sharpe ratio of 1.0 needs about 6 years of returns to reach a t-statistic of 2, a Sharpe of 2.0 needs about 3 years, and 3.0 needs about 2.4 years. Under 12 months is rarely enough.
Is paper trading the same as live trading?
No. Paper trading logs signals in real time, which removes look-ahead bias, but it places no orders, so it skips spreads, slippage, partial fills and the emotions of losing real money. Treat it as a 1–3 month dry run between a backtest and a small live test.
What should I do if a strategy underperforms its backtest once live?
First check whether the gap is within normal decay: live Sharpe ratios ran a median 73% below backtests in a 215-strategy study. Compare costs and trade count with the backtest, then apply the stop rule you wrote before going live. Avoid re-optimizing the rules on the losing period.
How often should I compare live results with the backtest?
Compare them every quarter, or every 25 to 50 trades for fast strategies. Track live Sharpe ratio, average trade, maximum drawdown and costs side by side with the backtest. Drawdown is the most comparable figure: across 888 algorithms, backtested drawdown explained 34% of the variation in live drawdown.
Sources
- Suhonen, A., Lennkh, M. & Perez, F. (2017). Quantifying Backtest Overfitting in Alternative Beta Strategies. Journal of Portfolio Management
- CXO Advisory: Live Performance of Alternative Beta Products (Apr 2016 summary of Suhonen et al.)
- Wiecki, T., Campbell, A., Lent, J. & Stauth, J. (2016). All That Glitters Is Not Gold: Comparing Backtest and Out-of-Sample Performance on a Large Cohort of Trading Algorithms. Journal of Investing 25(3)
- CXO Advisory: In-sample vs. Out-of-sample Performance of 888 Trading Strategies (June 2016)
- Bailey, D., Borwein, J., López de Prado, M. & Zhu, Q. (2014). Pseudo-Mathematics and Financial Charlatanism. Notices of the AMS
- Lo, A. W. (2002). The Statistics of Sharpe Ratios. Financial Analysts Journal 58(4)
- eCFR: 17 CFR § 4.41, Advertising by commodity pool operators and commodity trading advisors (accessed Nov 3, 2026)
- SEC: Sweep into Marketing Rule violations results in charges against nine investment advisers (Sept 11, 2023)
- K&L Gates: Hypothetical Performance Crackdown (Sept 13, 2023; Marketing Rule compliance date Nov 4, 2022)
- IRS: Topic No. 409, Capital Gains and Losses (accessed Nov 3, 2026)
- TruthSayer AI: Valuations AI© Index and trade table (Nov 3, 2026)
- TruthSayer AI: Earnings AI© Index and trade table (Nov 3, 2026)
- TruthSayer AI: Dark Pools AI© Index and trade table (Nov 3, 2026)
- TruthSayer AI: GIPS® compliance and verification reports (accessed Nov 3, 2026)
This article is for educational purposes only and is not investment advice. Past performance does not guarantee future results.
Nathan Njuguna
Nathan Njuguna is Lead Data and Machine Learning Engineer at TruthSayer AI, specializing in quantitative research, machine learning, and data engineering. He develops and validates systematic trading strategies, builds predictive models, and designs backtesting frameworks so trading signals are statistically validated, reproducible, and ready for production.